How to Track Your Email Campaign Statistics in SendPulse
With SendPulse, you can track your email campaign results to better understand your target audience and tailor your marketing strategy. Monitor your delivered and opened emails,click-throughs,email open rate, users’ location and device types.
In this article, we will talk about how to enable statistics collection and tracking in your SendPulse and Google Analytics account.
Create an Email Campaign
Start creating a campaign. Fill in the fields in "Information About Campaign" during the first step (campaign name, mailing list, sender email address, sender name, andsubject line).
During the second step, in "Message Content," select, upload, or create a template, and enter your text.
Read more:How to Send an Email CampaignandHow to Create Your Own Template.
Enable Email Statistics Collection
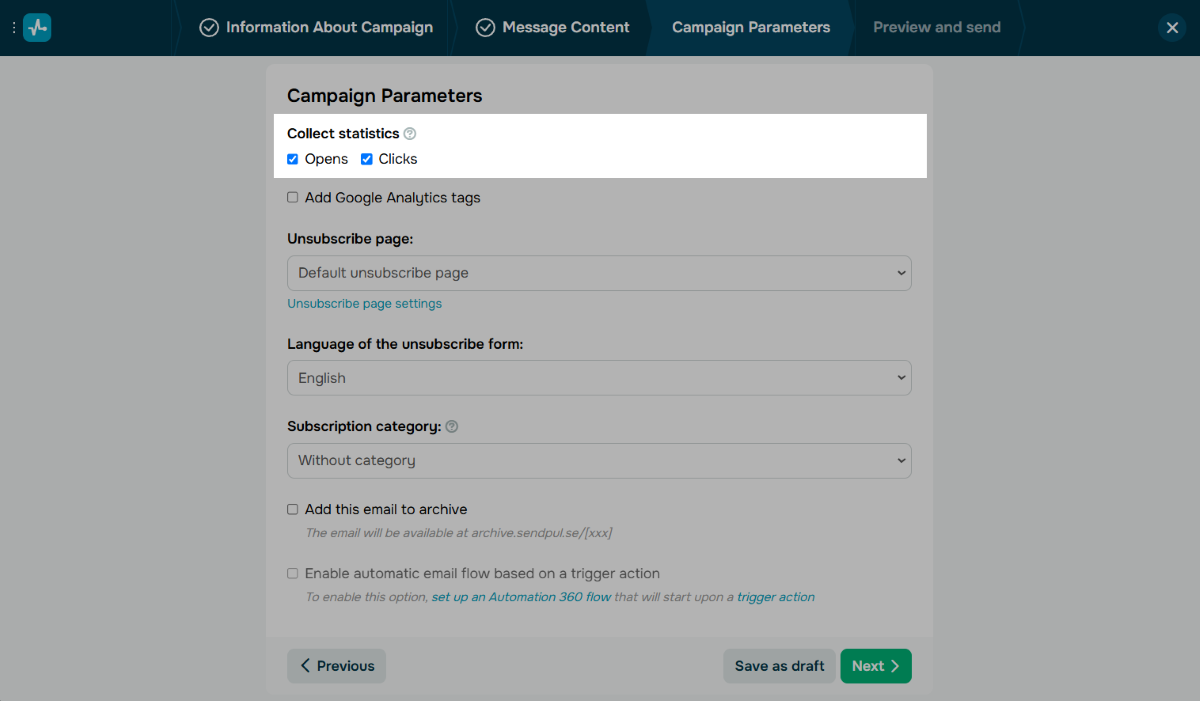
During the third step of creating your campaign, in "Campaign Parameters" > "Collect statistics," you can select the "Opens" and "Clicks" checkboxes — this is enough to start collecting statistics in SendPulse.
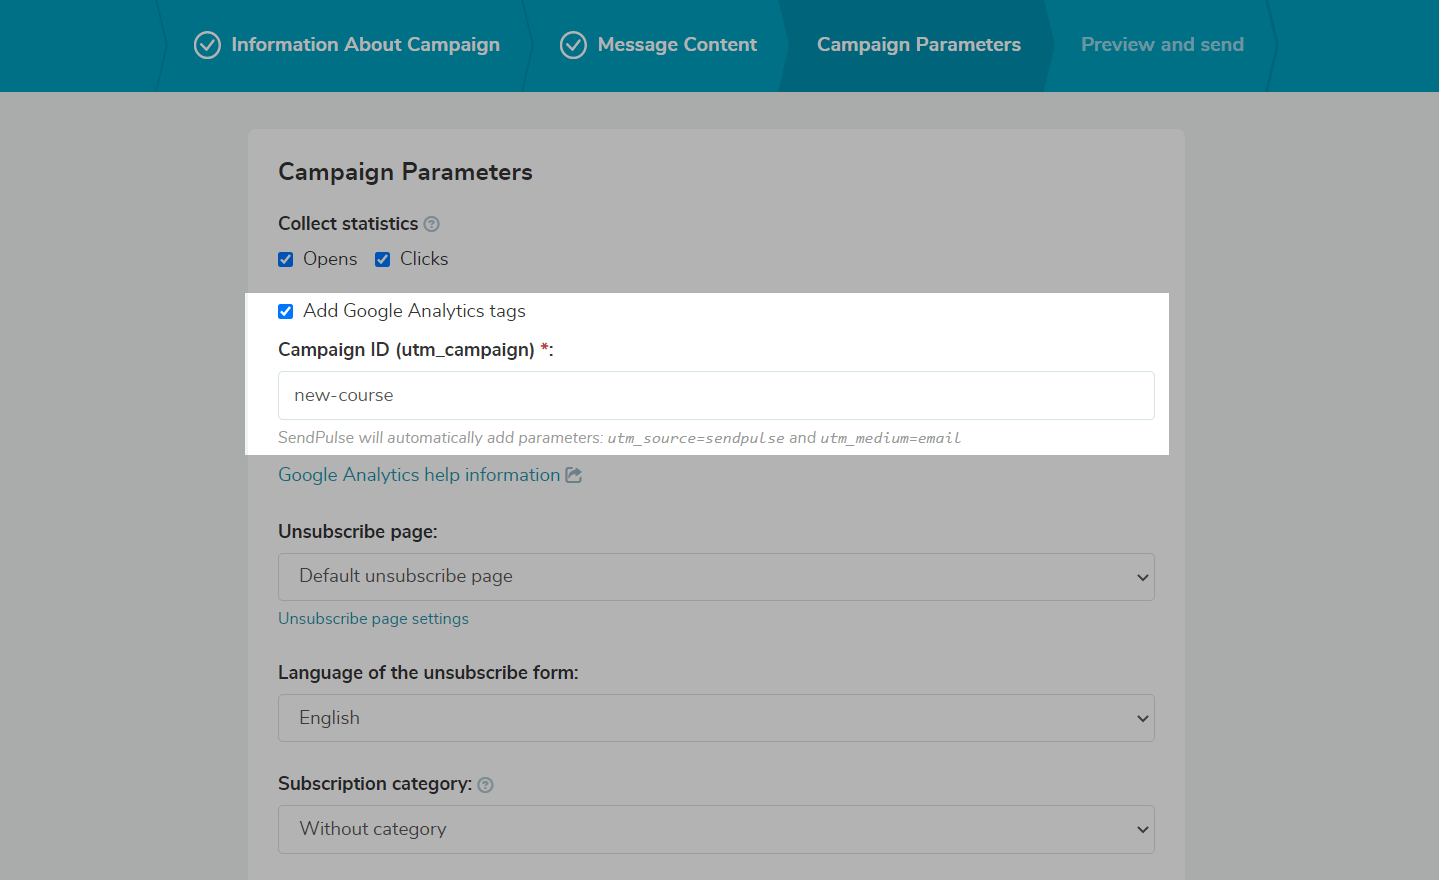
To track statistics in Google Analytics, select the "Add Google Analytics tags" checkbox, and enter a campaign name.
Theutm_campaigntag is your campaign name, and you can use it to find your campaign details in Google Analytics. Theutm_sourceandutm_mediumtags are added automatically.
Track Your Statistics
In Your SendPulse Account
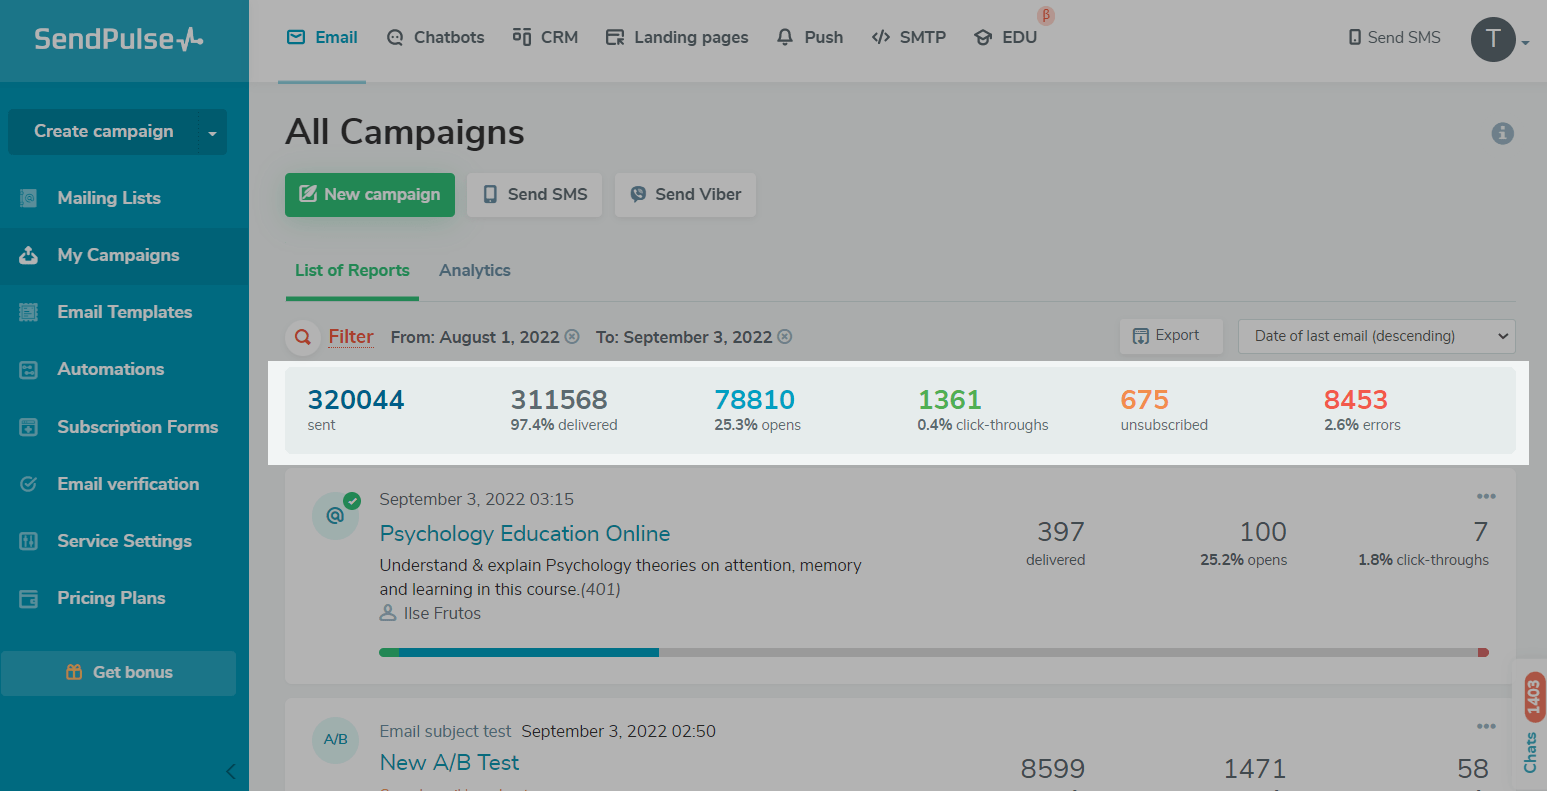
Go to "Emails" > "My Campaigns."
在列表的顶部,你会看到总number of sent, delivered, and read emails, click-throughs, unsubscribes, and delivery errors for the time selected in the filter.
You can also view your number of delivered emails, opens, and click-throughs for each campaign.
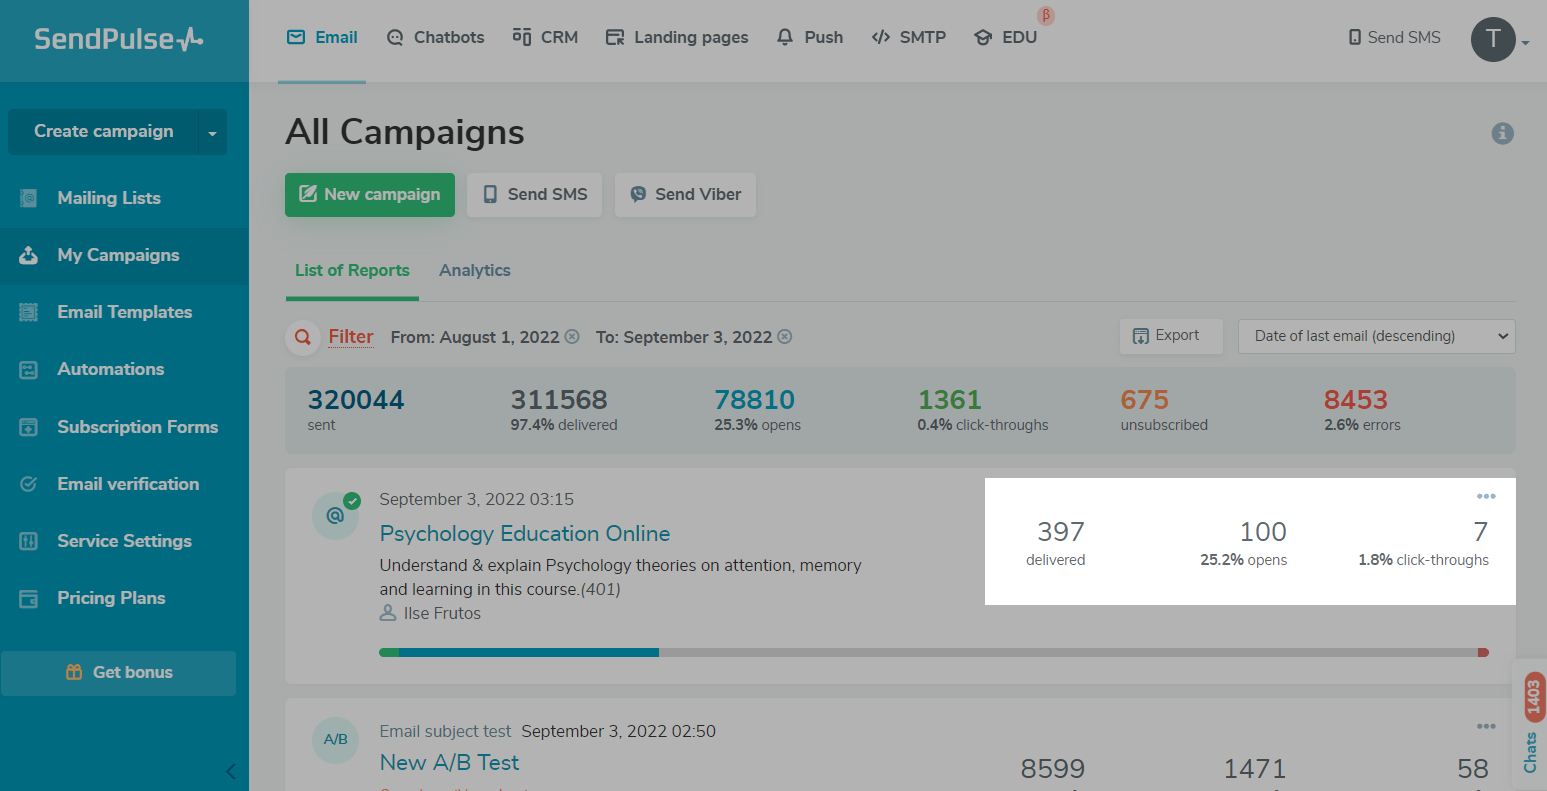
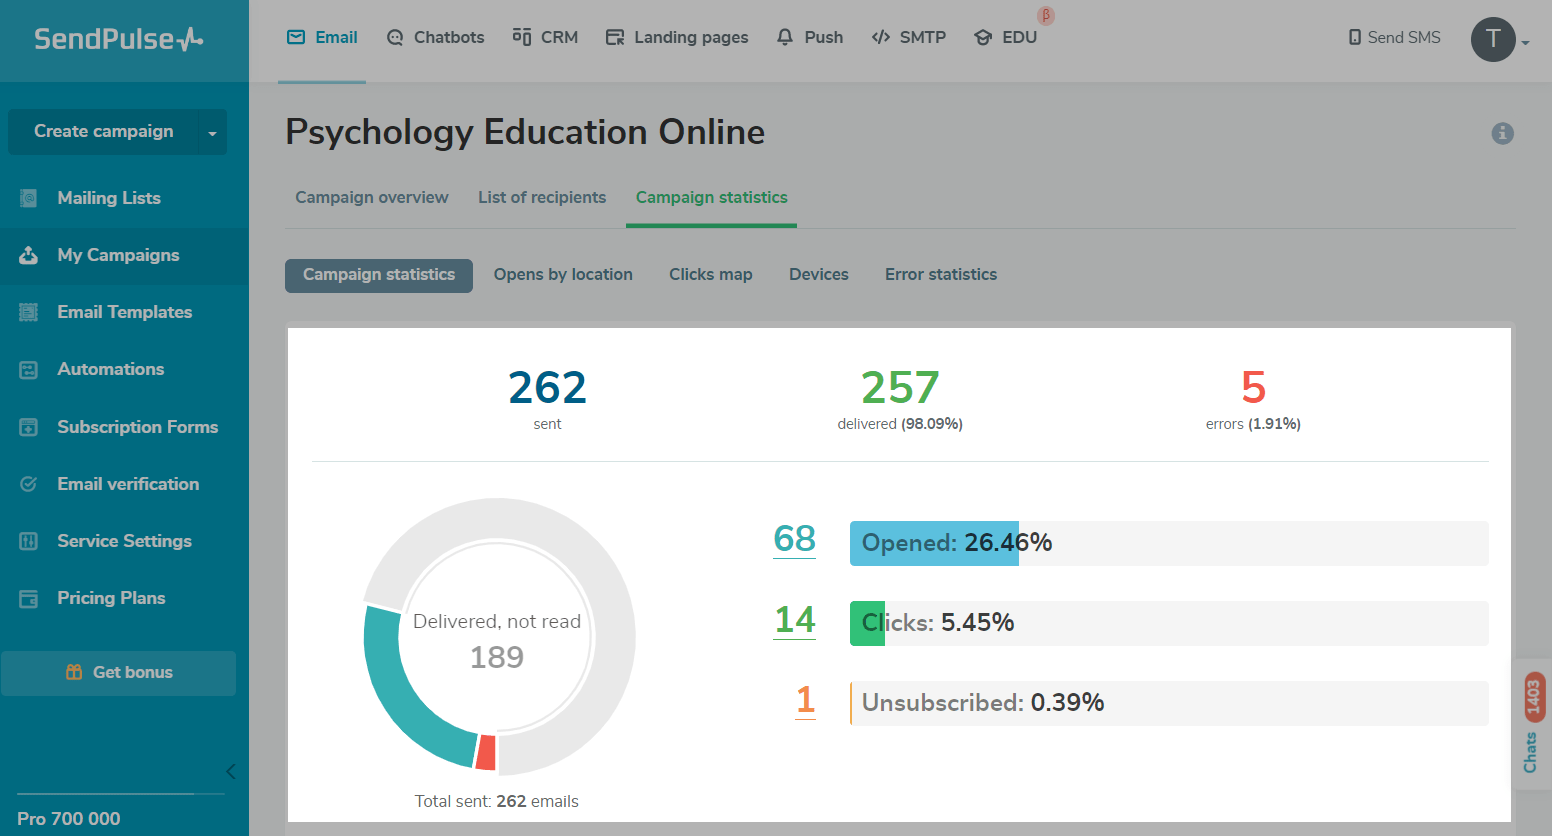
Open a campaign from the list to view its detailed statistics.
In the "Campaign Statistics" > "Campaign Statistics" tab, you can view your overall statistics on sent, delivered, and read emails, as well as the number of click-throughs and delivery errors for all time.
Below is the graph of subscriber activity. By hovering over any point on the graph, you can view the number of read and clicked-through emails for the specified time.
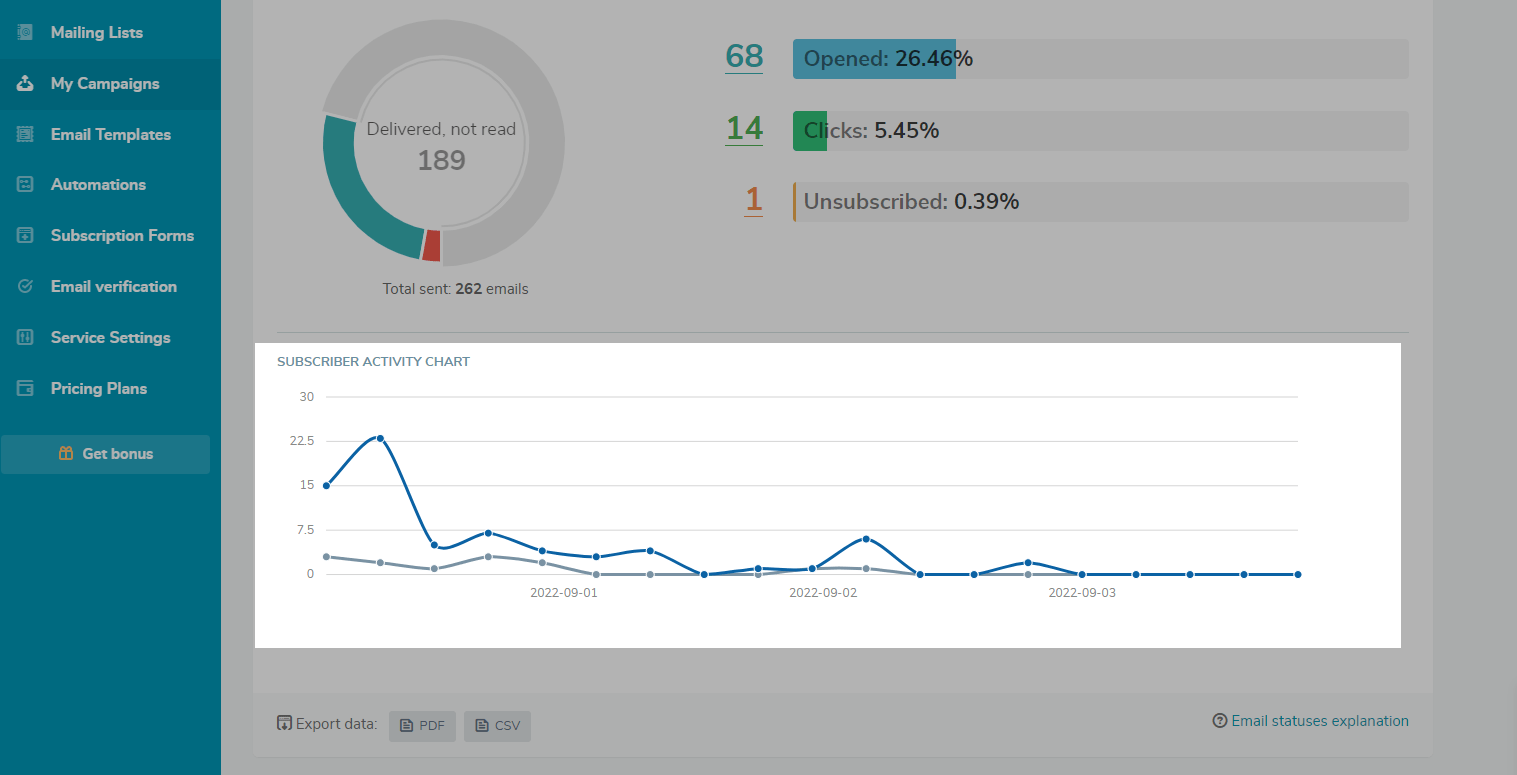
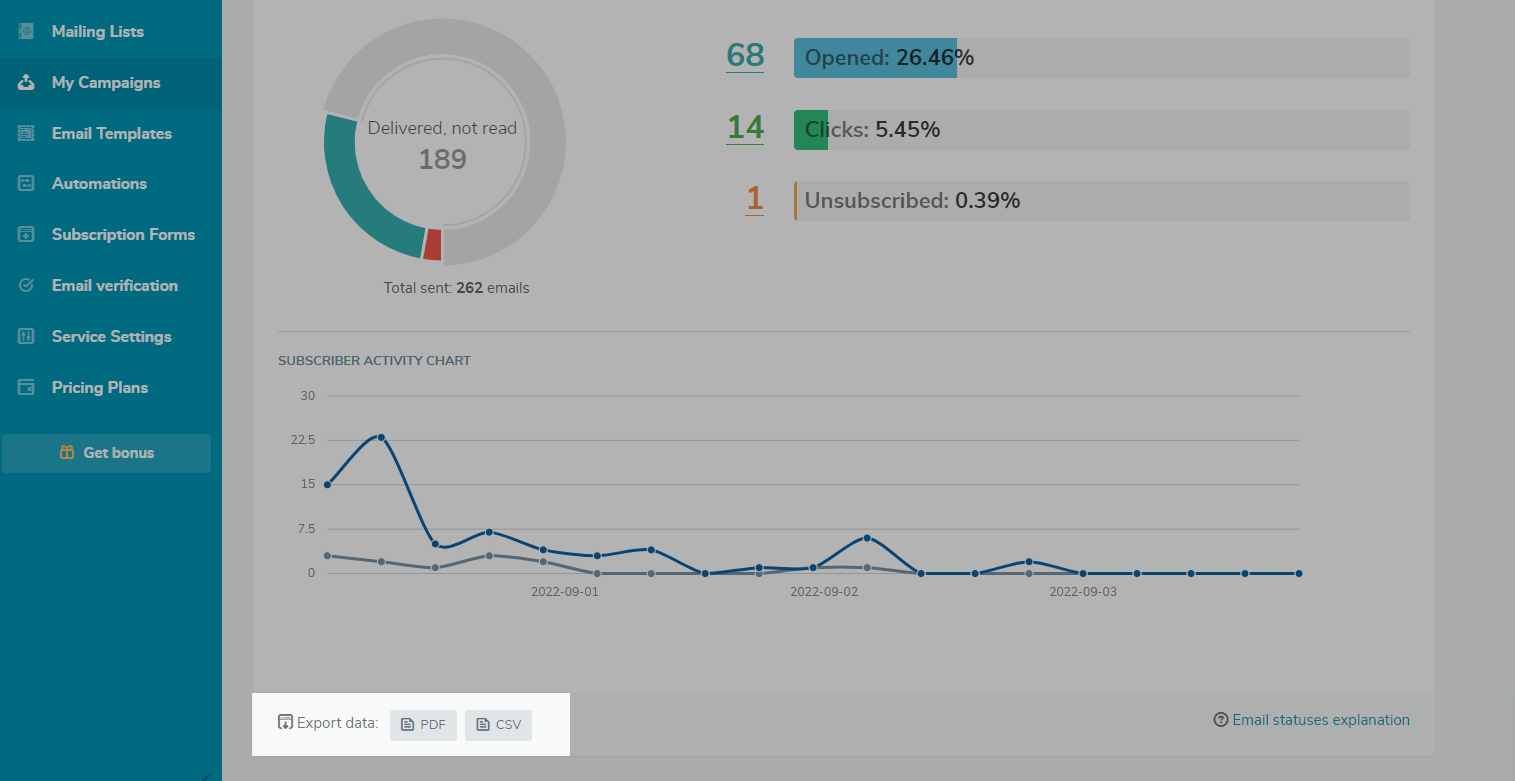
You can alsoexport statisticsin PDF or CSV format.
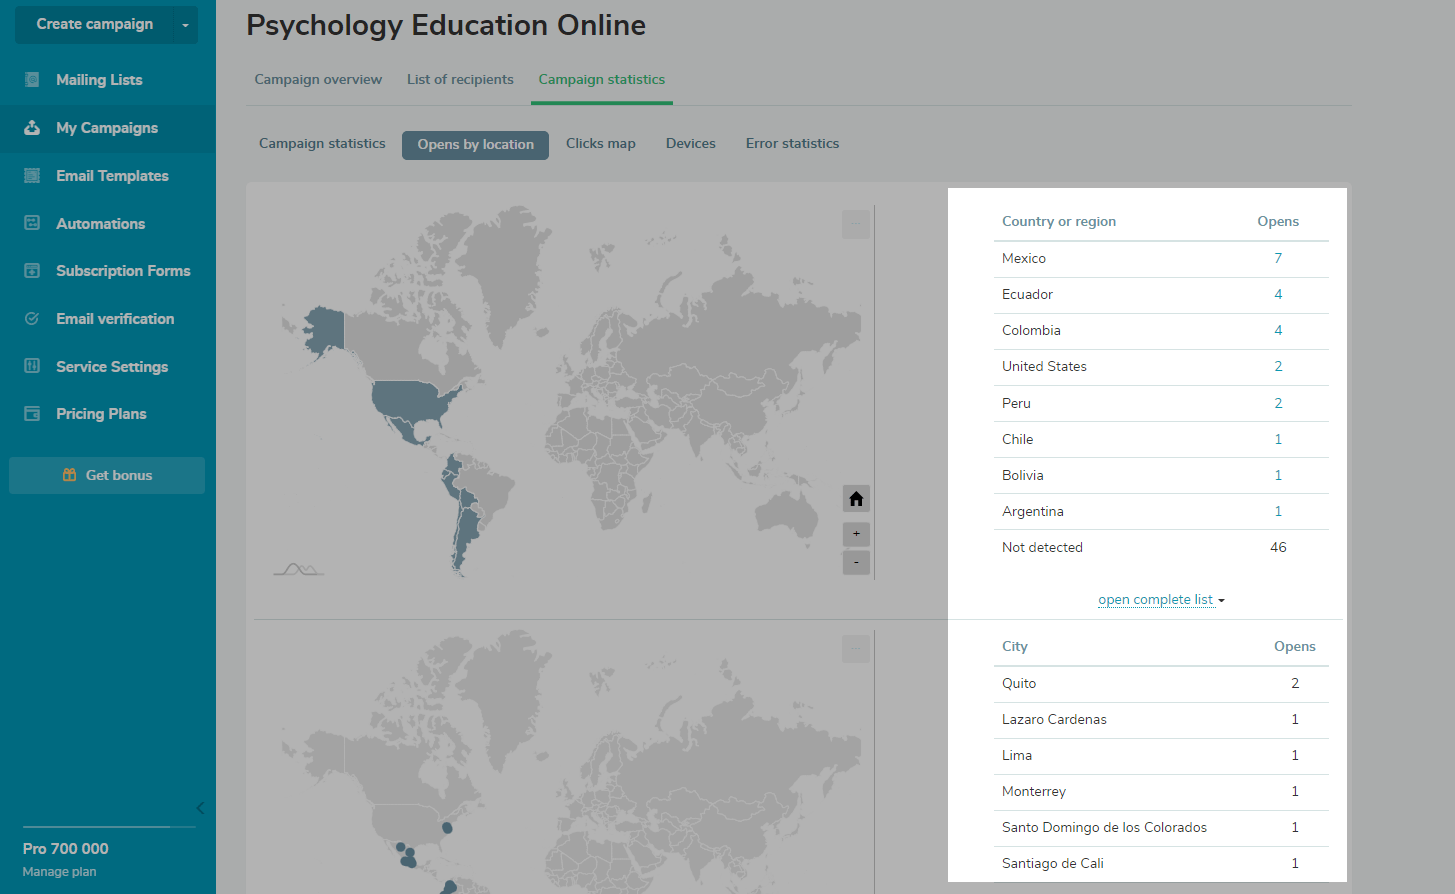
In the "Opens by location" tab, you can monitor the countries and cities where users opened your campaign. Hover over and scroll to zoom out.
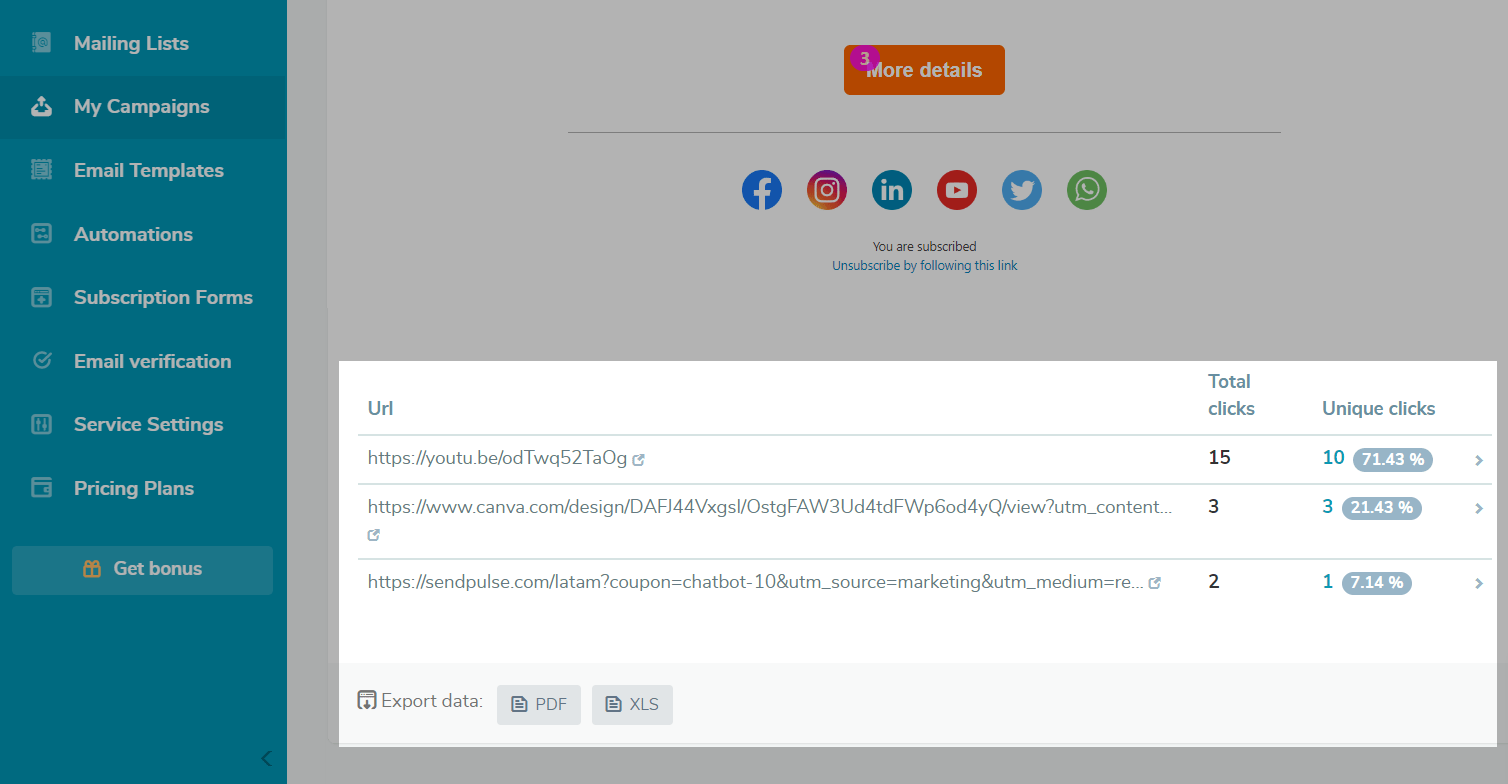
In the “Clicks map” tab, you can see which link users clicked and how many times they did it, for example, it can be a link in the text or social media button.
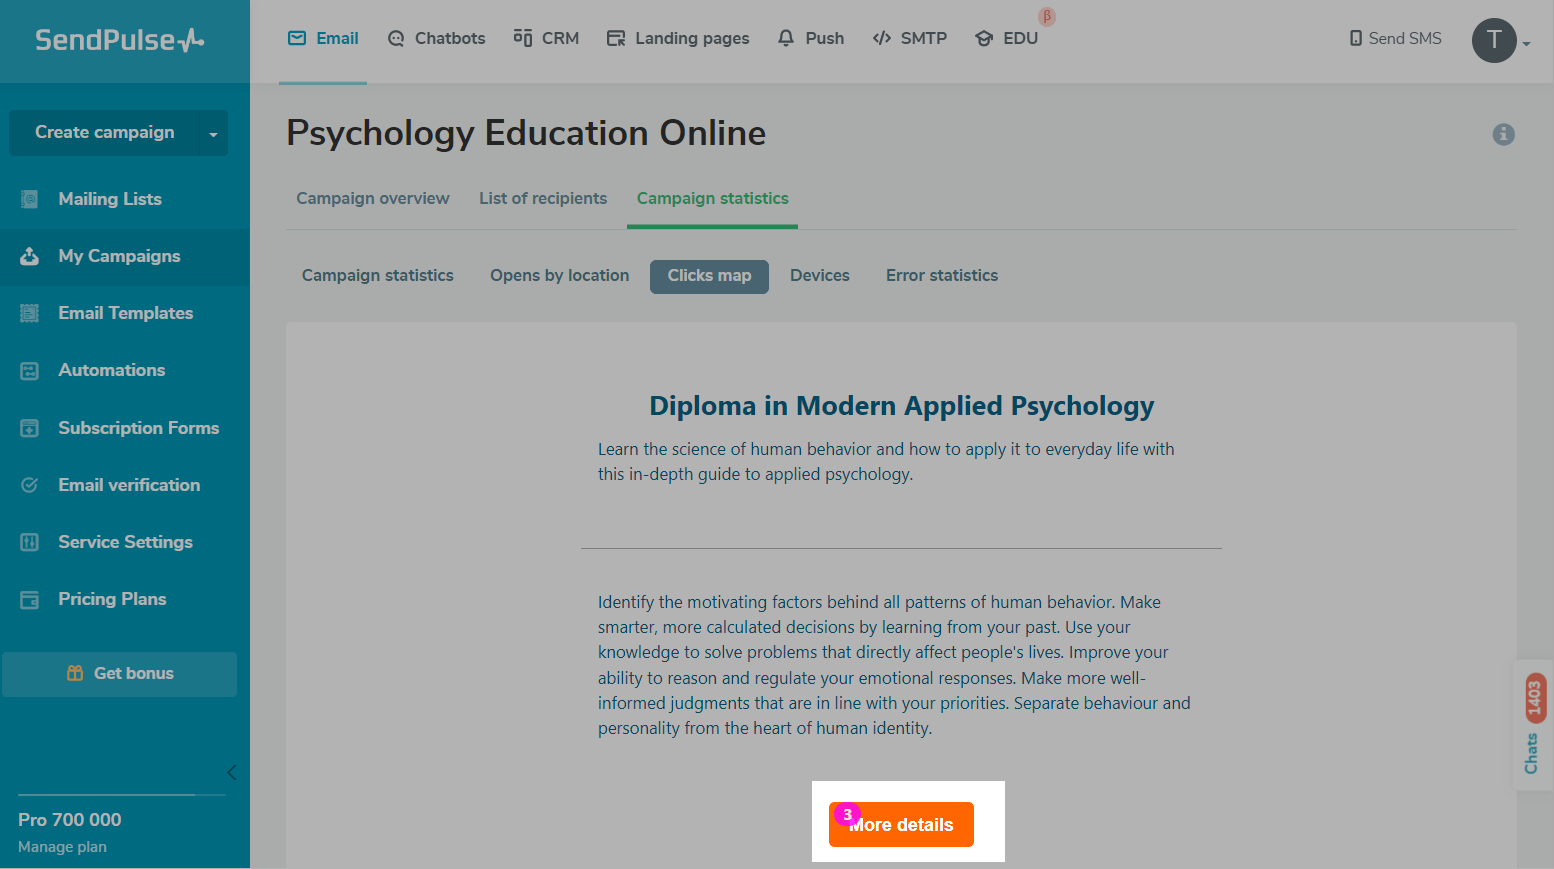
Below is the table with the links users followed and the number of click-throughs (total and unique).
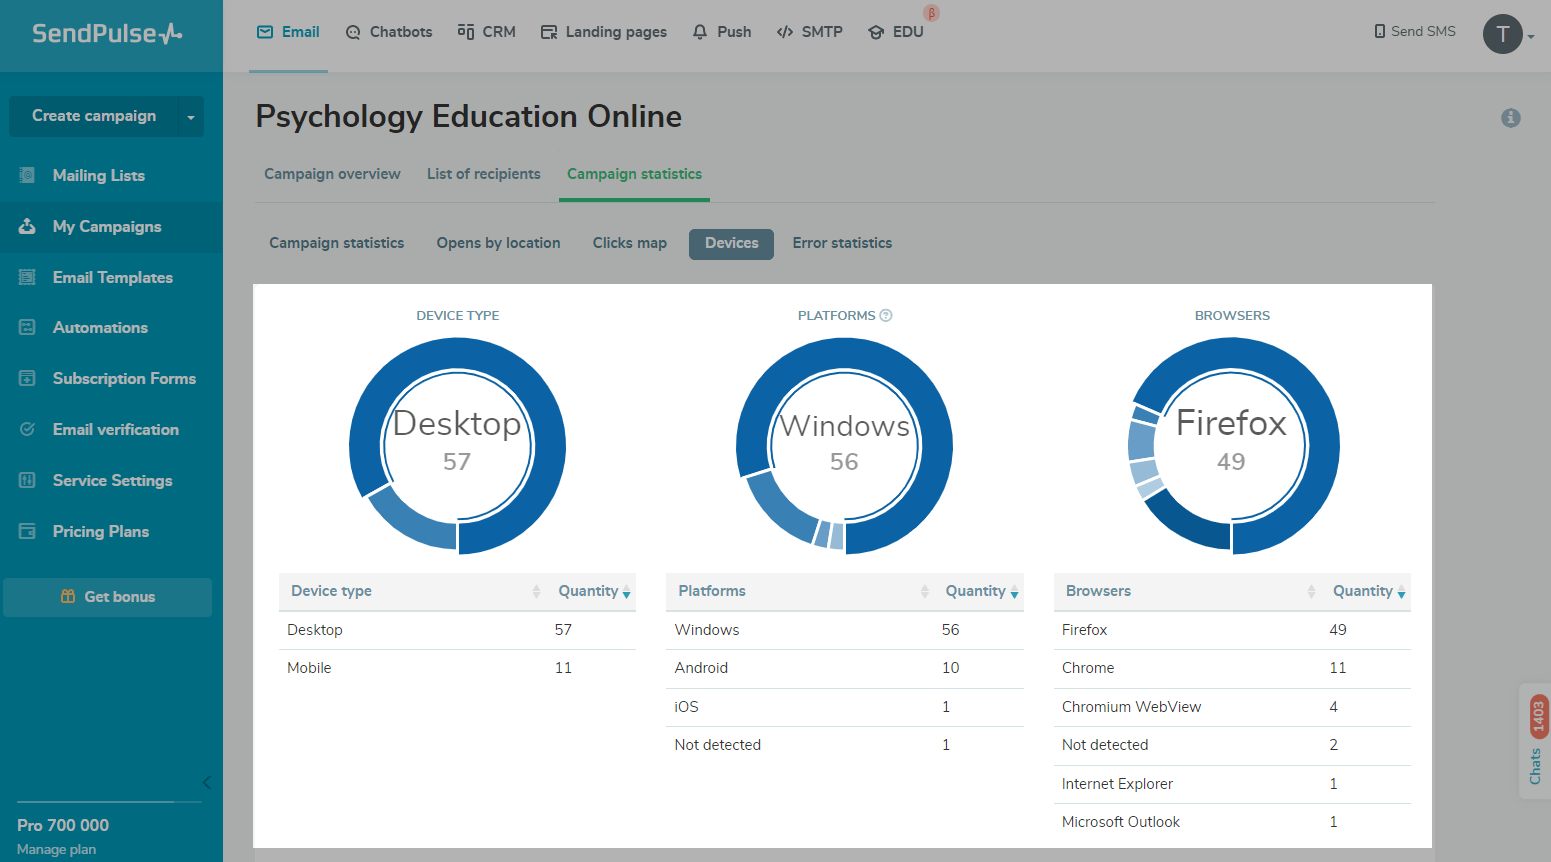
In the "Devices" tab, you can see which devices and browsers recipients used to open your email.
In the "Error statistics" tab, you can view the number of email addresses to which your email was not delivered and why.
Read more about errors:Email Statuses Explanation.
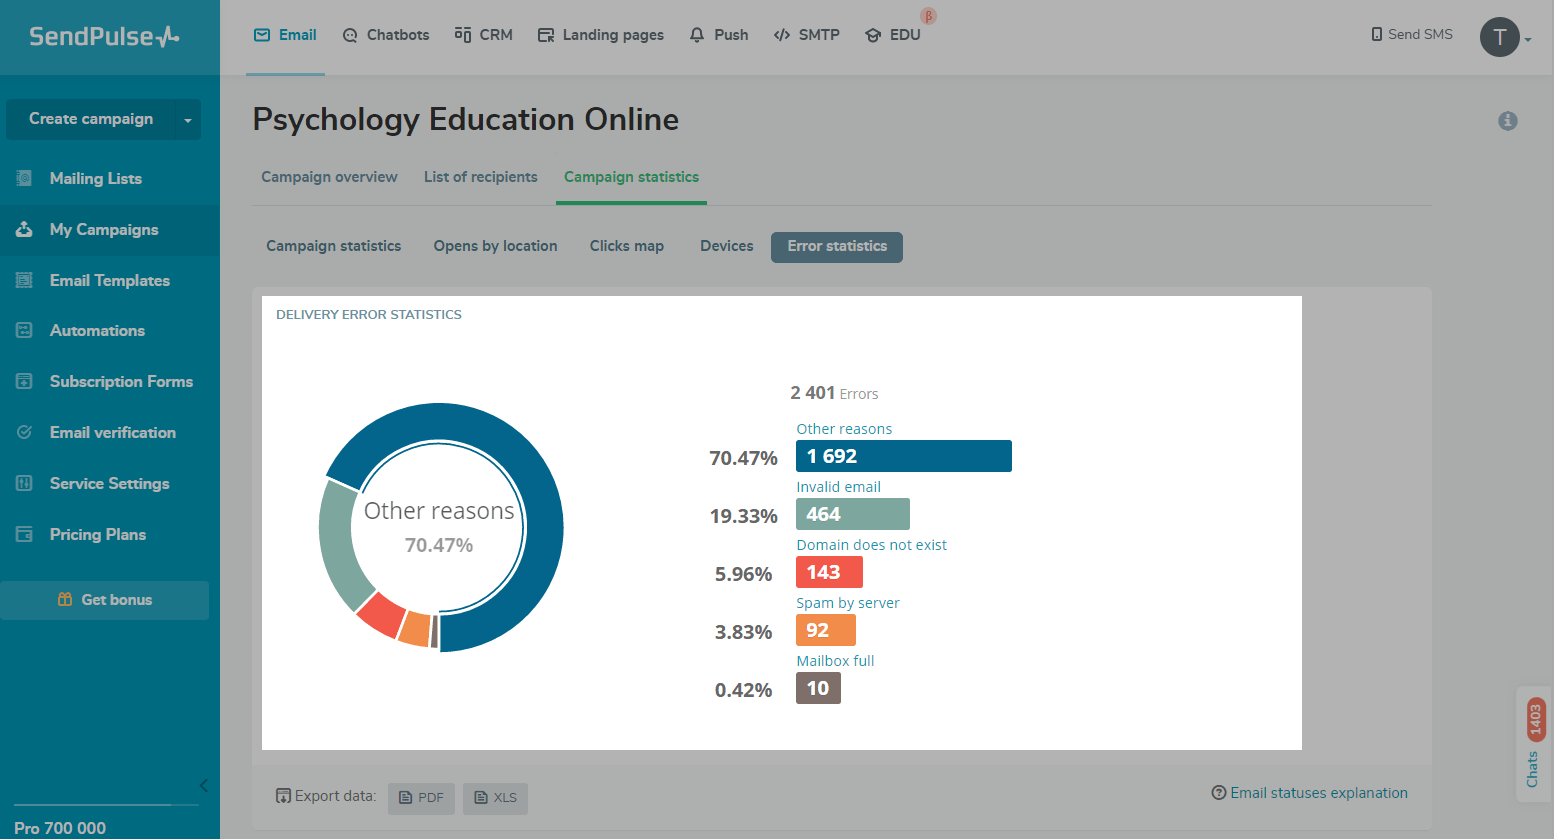
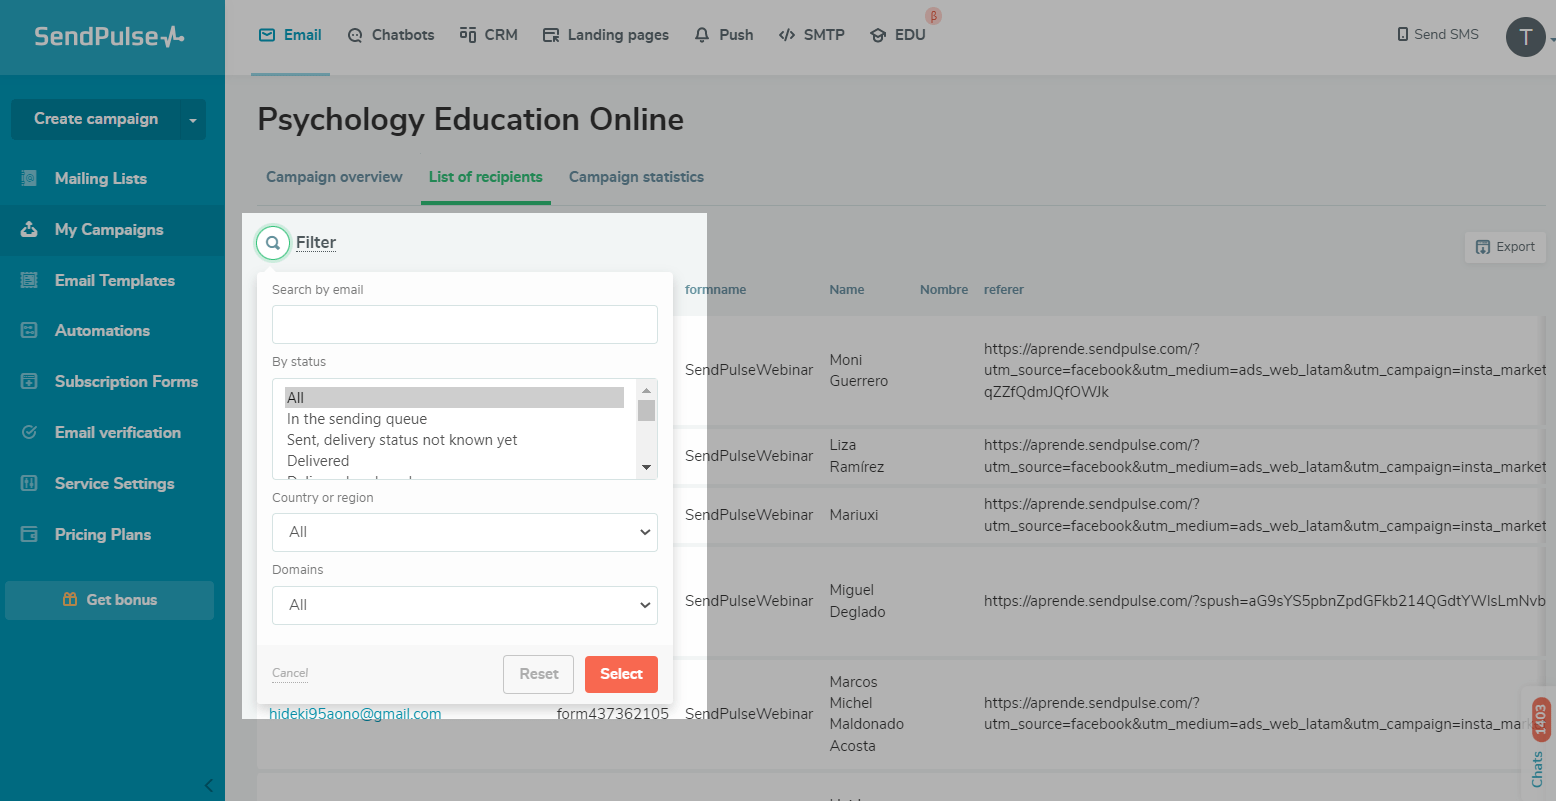
To see the list of email addresses to which your campaign was not delivered, click an error name, or go to the "List of recipients" tab, and select the corresponding status in the filter.
In Google Analytics
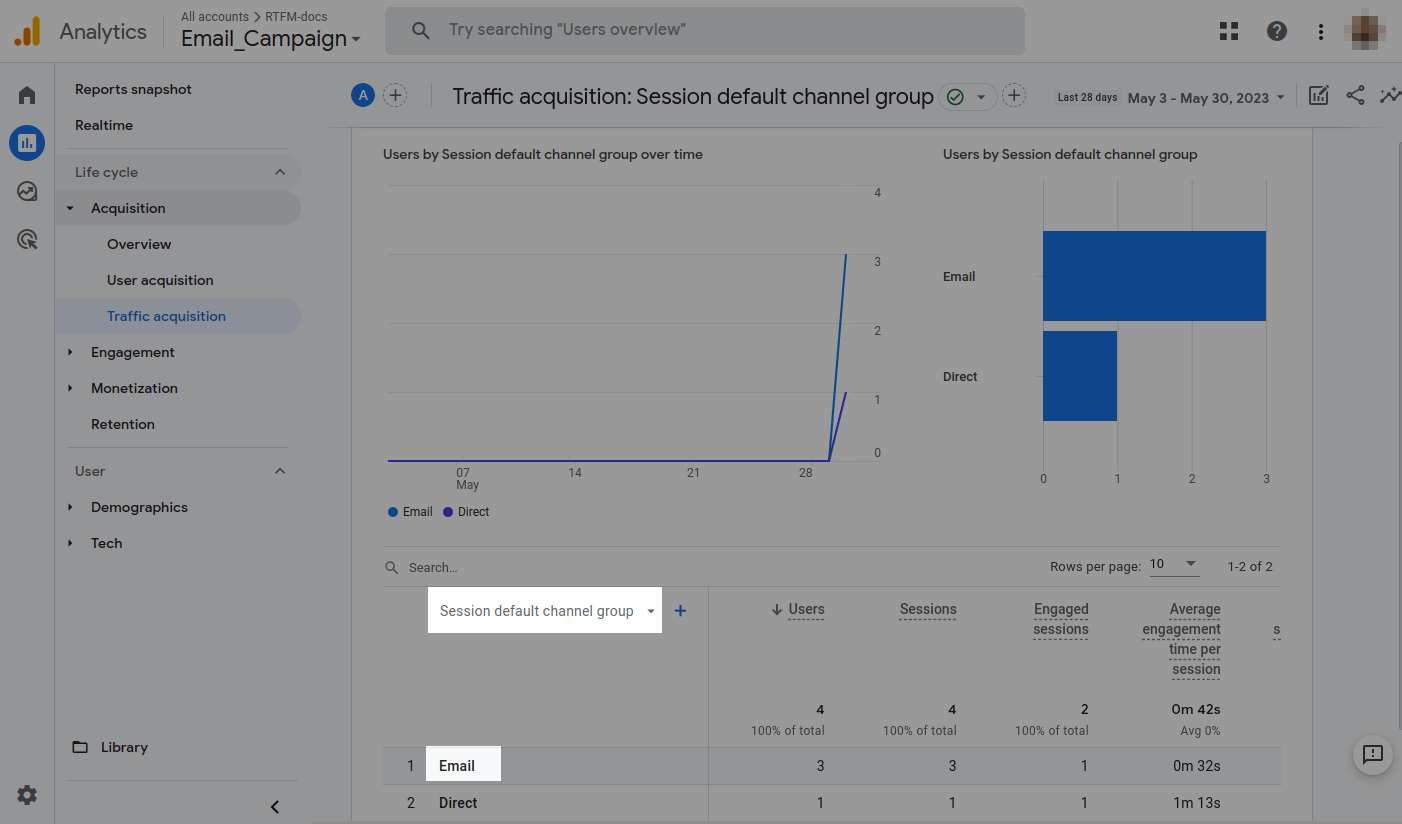
Go to “Acquisition” > “All Traffic” > “Channels.”
Find your statistics on the "email" channel in the table.
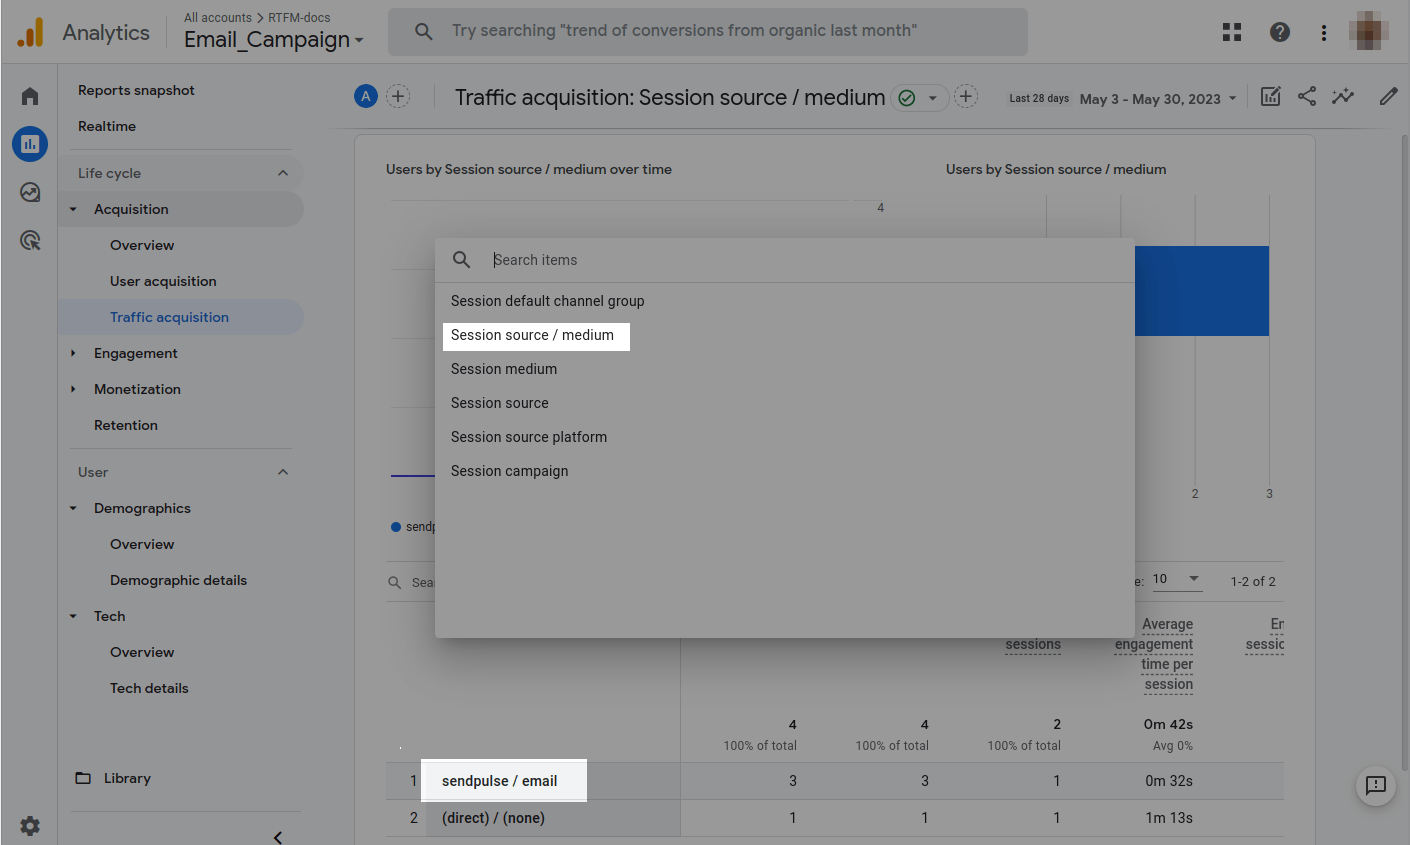
To view campaign data, from the “Other” drop-down menu, open the “Acquisition” list, and select “Campaign.”
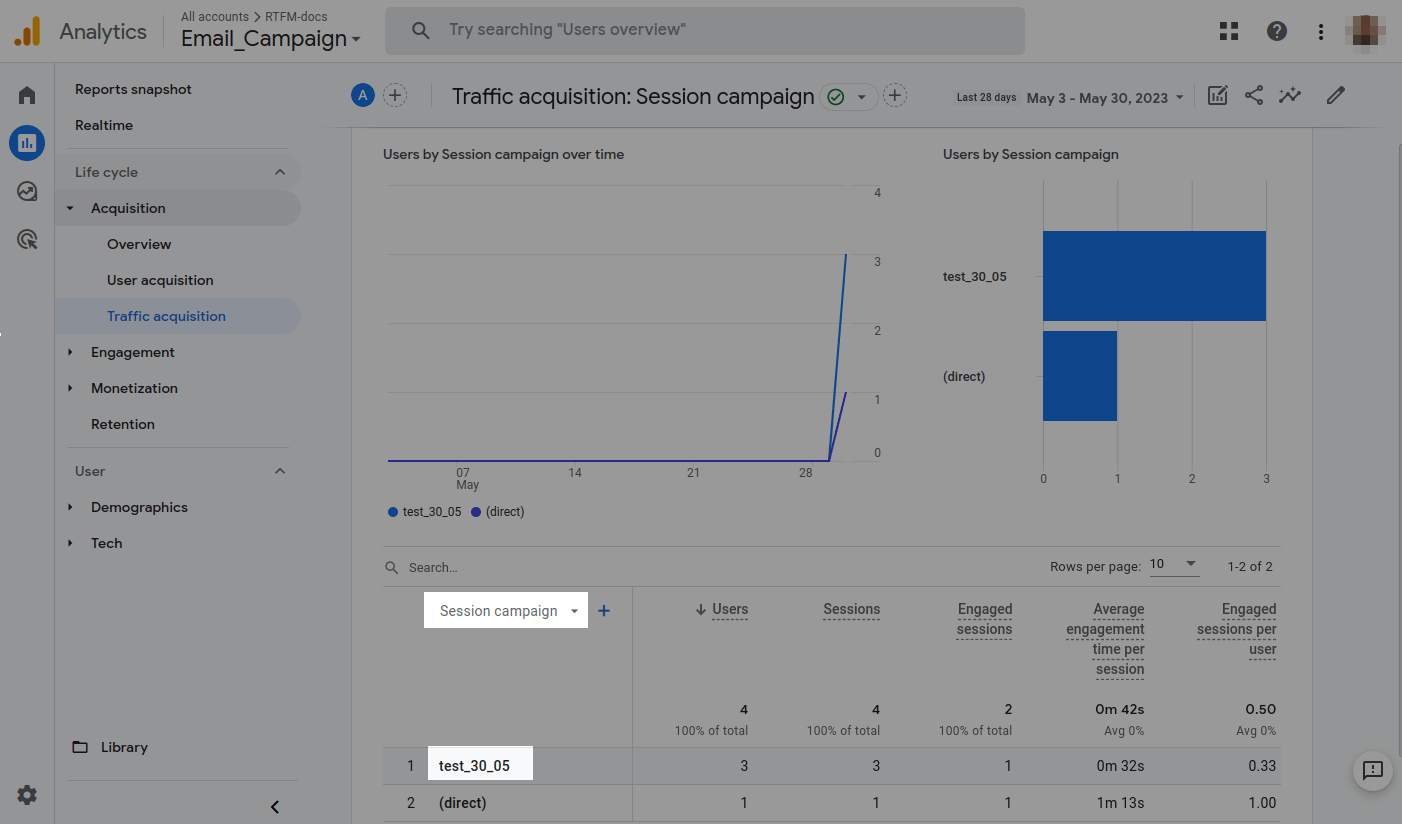
In the “Campaign” column, find a name that matches theutm_campaigntag in the campaign you are interested in.
根据您的设置s, Google Analytics may display different data. To better navigate its settings, check outthe Google Analytics documentation.
Last Updated:22.02.2023
Sign up with
Sign in with Facebook Sign in with Google